HDX Team 3 - Smart Grocery
Background
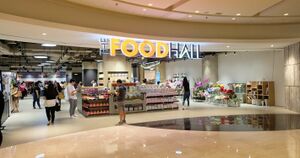
The Foodhall is one of PT Mitra Adiperkasa Tbk business segments. The business is grocery retail with two types of premium supermarket concepts: The Foodhall, a large format supermarket and Daily Foodhall, a smaller format supermarket located mostly in residential areas. Our project team has been tasked to examine Foodhall’s current retail strategy and propose viable solutions for The Foodhall.
The COVID-19 pandemic has posed numerous challenges to businesses especially those that are operating as brick and mortar stores. It is just one of the factors listed by our stakeholders as motivation for a rethink on retail strategy. Another consideration is how Foodhall can structure an end to end solution for its supply chain that would reduce wastage, reduce middlemen, and enhance the experience for its suppliers and consumers by offering fresh foods at the best possible price and quality.
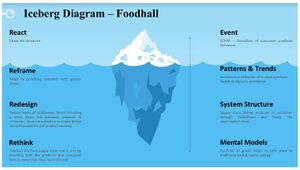
The team got down to our challenge by first looking at the system, namely the supply chain. We used the iceberg model to identify patterns and trends as well as the mental models, we also looked at our system problem statement to define our why of the challenge as well as the what and how. We came up with the stakeholders most relevant to the challenge at hand and their importance relative to Foodhall. Descriptive goals were then drawn up and metrics for measurement to keep us aligned to success led to the next steps which was to develop an app that would track purchase and supply data and democratise this across the entire supply chain to achieve better provision of fresh foods to the end user and reduce waste. These various steps are highlighted in the next sections.
Team Members
Background Research
To gain a better sensing of the project and being continuous learners, several sources of information proved useful to our team. These articles allowed us to gain insights into the best practises of supply chain management, in particular to the farming and grocery business
https://hackerfarm.jp/2019/04/the-food-chain-japanese-agriculture-from-farm-to-supermarket/
https://www.relexsolutions.com/resources/managing-grocery-retail-supply-chains/
https://www.gartner.com/smarterwithgartner/3-steps-to-a-digital-supply-chain/
Iceberg Model (Systems View)
The figure shows our iceberg model for our complex system from a consumer standpoint. From the business standpoint, after speaking with our stakeholder Foodhall, we understand that there is sometimes a separation in ordering patterns at the store level as opposed to head office as well as a reliance on manual modes or ordering. Hence, it would be of value to create a unified end to end solution that would be able to handle both store level and head office level ordering and supply management. In our redesign, some stakeholders such as the middlemen suppliers might be displaced especially if they cannot consistently deliver value to the produce supply chain, or integrate into the idea of information exchange and systems integration but that this exercise is worth the effort as it would bring in more predictable outcomes such as a more responsive supply chain.
Goal Statement
Our team examined the goal of the challenge and how to deliver value to the project that is representative of real success. The ‘To, By and Using’ goal statement we established is:
To: Reduce wastage of perishable produce, get low price for customer while improving farmers’ welfare
By: Shortening the produce supply chain through predictive orders
Using: An on-demand digital ordering system
We further expanded the goal statement by examining the stakeholders who would be a part of this produce supply chain, what their needs would be, and their importance to Foodhall and conversely Foodhall importance to the stakeholders. This was mapped onto a 3x3 grid to show pairwise interactions. Our team also listed the descriptive goals of the challenge project. We categorised them according to their importance (i.e. critical, important and desirable) as well as the rigidity of each of the descriptive goals (i.e. constraining, mildly constraining and unconstrained). We also tagged metrics to each of the goals. We had 14 descriptive goals in total.


